TechNote 2015004: Health Reports
| Document Identifier: | TechNote 2015004 |
| Document Date: | August 25, 2015 updated June 12, 2018 |
| Software Package: | SWARM |
| Version: | Swarm 7.5.3 or later |
Abstract
As of release 7.5.3, the Swarm admin console provides the ability to link to a DataCore-provided summary analysis of the health reports your Swarm cluster is sending to DataCore. This document is intended to assist you in interpreting the data presented in that analysis.
The target audience for this paper is Swarm administrators.
About Health Reports
Network Requirements
For your cluster to send health reports to DataCore, it must have public internet access. If that is in place, sending is automatic. It is possible to configure Swarm to route to the internet via a proxy, if that is necessary to reach the public internet from your cluster. These health reports are used by DataCore to construct an analysis of the health of your cluster. If your cluster is sending health reports, and if it has a defined cluster settings UUID (this will be true if you have ever changed any settings on your cluster), and the cluster name has been set, then you will be able to view these analysis reports. The reports are served from a CloudScaler instance at DataCore - to view them you’ll need a modern browser such as Chrome or Firefox and an internet connection.
Information Transmitted
The information transmitted by each Swarm node is essentially the same information that would be retrieved by an SNMP dump. However, any information that could reveal your data (such as the list of domains) is omitted. The information is encrypted and sent back to DataCore via SSL, where each report is stored in a Swarm cluster. Each node reports once in each 24 hour period. Periodically (currently every 2 hours), an analysis of the data is updated to extract data relevant to understanding what is happening in the cluster.
Understanding the Analysis
The analysis report is organized into several blocks. Here we explore each of them in turn. The graphs provide additional information if you hover your mouse over them.
Overview Block
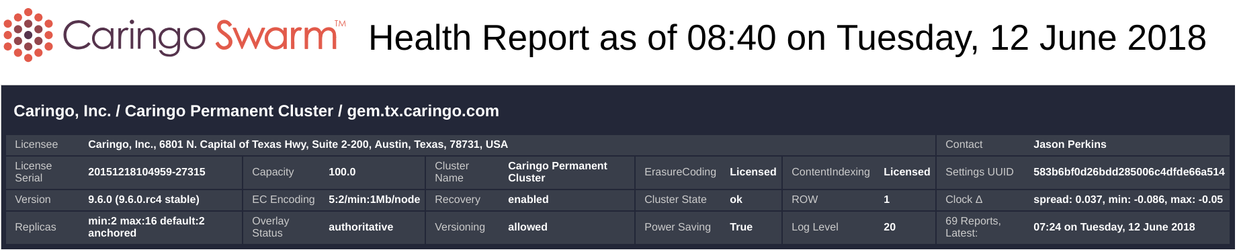
This block provides basic overview information about the cluster and the associated Swarm license. The title says “as of 08:40 on Tuesday, 12 June 2018” - this time (along with all timestamps in the report) is in US Central Time. Each Swarm license enables a certain amount of capacity (in terabytes), and optionally enables ErasureCoding and ContentIndexing. Clusters normally have a persistent settings UUID which uniquely identifies the cluster. If ErasureCoding is enabled, the cluster’s default encoding parameters are shown under EC Encoding. Cluster state is the top level status on the console - potential states include “ok”, “error”, “retiring”, etc. Replicate on Write (“ROW”) is by default enabled. Clock 𝚫 is an approximate measure of clock drift in your cluster - normally this is not something of concern. Replicas indicates your default setting for the minimum, maximum and default number of replicas for non EC objects. If your cluster has 32 or more nodes, the overlay index can be enabled, visible under Overlay Status. Latest Report is the timestamp for the last report received.
Load and Space Sections
Load
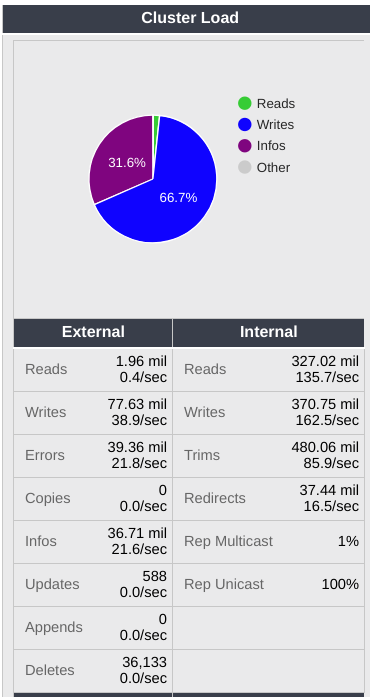
Swarm load statistics are accumulated since cluster boot. Cluster load comes from two sources, external and internal. External load results from client requests - reads, writes, deletes, etc. Internal load is primarily a result of the health processor’s operations inside the cluster. In both cases, you'll see the total number of operations since boot along with an estimated rate in operations per second. RepMulticast and RepUnicast are settings that control the amount of network traffic used by the health processor. Normally these won’t require attention.
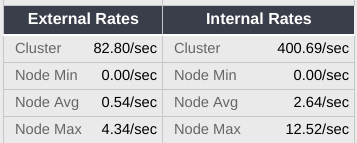
The rates under “External/Sec” and “Internal/Sec” represent the approximate load on the cluster. These are calculated by looking at the two most recent reports for each node (which together give us the number of operations completed in the previous 24 hour period) and summing them then dividing by the time interval. Values for a cluster rebooted within the past 48 hours are likely to be inaccurate.
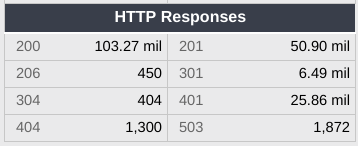
HTTP responses gives the numbers of responses to requests issued. Usually these will be 200 or 201 or 301 (redirect).
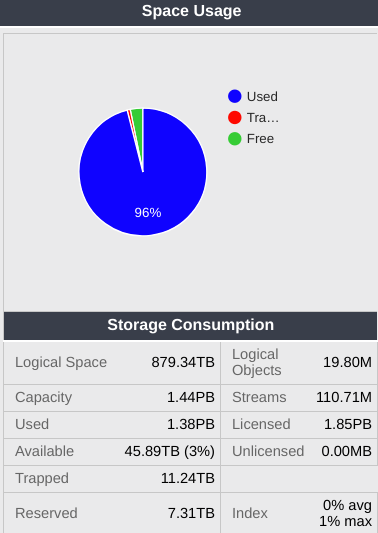
Space
Cluster space is divided into 3 different pools. Used space is occupied by user data. Free space is immediately available for storage. Trapped space contains deleted data which needs to be defragged before use. Each volume must reserve enough space to be able to defrag - normally this will be 2x the size of the largest object stored on the volume. Totaling those across the cluster results in the Reserved number here. Capacity represents the cluster’s physical storage capacity. Licensed represents the licensed capacity. Streams is the number of objects stored - remember that this does not represent the number of user objects stored, but rather the internal representations. For example, in a cluster with reps=2 (two replicas, the default), there will be about twice as many streams as user objects stored. Logical Objects is an estimate of the number of user objects stored
Index utilization refers to the in-memory index used to keep track of objects. Normally the index for each node should be less than 80% full. Here we see the average percentage (“Avg Index”) across the cluster as well as the maximum (worst case - “Max Index”) for the cluster.
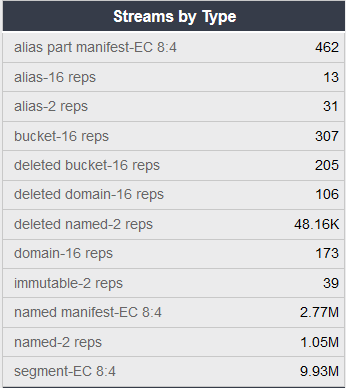
Below, we see streams by type stored in the cluster, organized by type. In the example cluster we see both erasure coded objects and replicated objects. Erasure coded objects each have a manifest (basically a list of the segments) plus a number of segments. Remember that the total number here will be much greater than the actual number of objects stored. For replicated objects, you’ll see the number of replicas times the number of objects stored. For erasure coded objects, you’ll see a manifest along with k+p times the number of objects stored as segments.
Protection Status
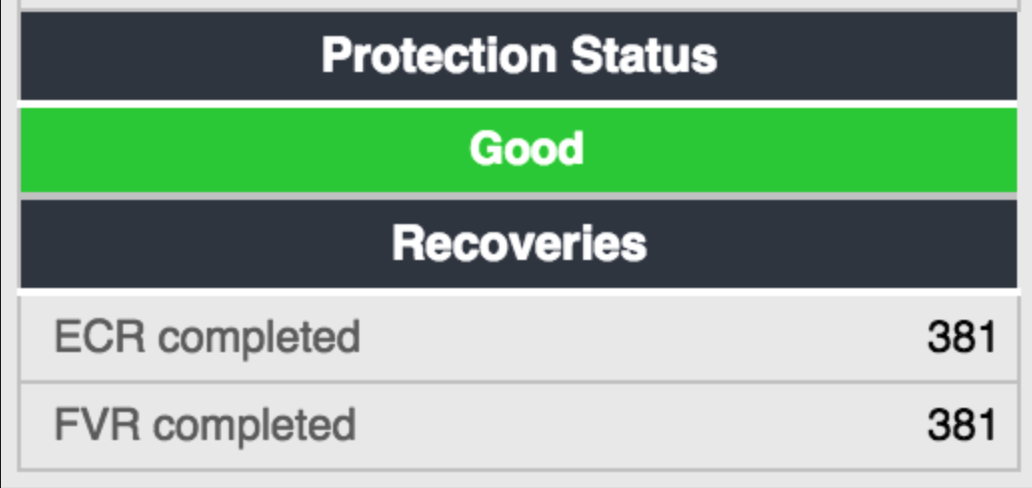
This is a simple green/yellow/red indicator summarizing data protection in the cluster. It will turn yellow if any recovery is in progress, or if any node in the cluster is showing more than 0.25% under-replication. It will turn red if any node is reporting more than 0.5% under-replication.
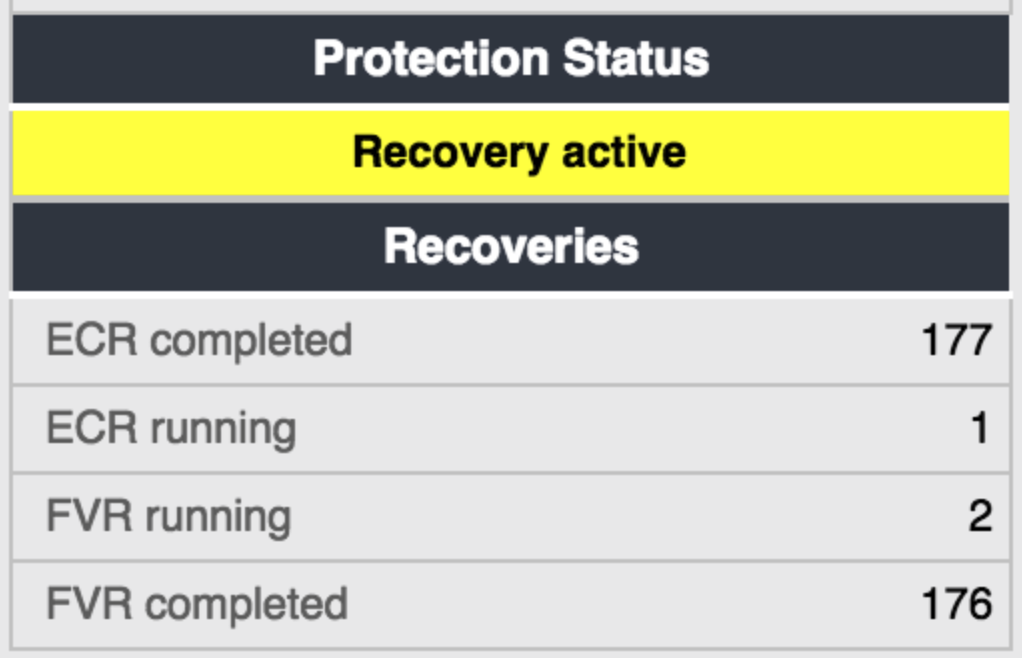
Recovery is a normal part of the data protection process in Swarm, and is nothing to be alarmed about as long as the cause (typically, a failed drive) is understood. It should complete promptly - completion will be faster the larger the cluster. If recoveries have occurred in your cluster, you will see a list below the protection status box. There are two kinds of recovery processes - ECR is “Erasure Coding Recovery” and “FVR” is “Failed Volume Recovery”. You will see both if your clusters have both kinds of objects stored. Each volume failure triggers more than one recovery - a recovery will be started for each remaining volume which has replicas of objects stored on the failed volume. These recoveries run in parallel - don’t be alarmed if you see several recoveries in process at once, that is completely normal. If you see an unexpected recovery, or a yellow or red indicator of under replication, please contact DataCore Support to assess the situation.

Node Summaries
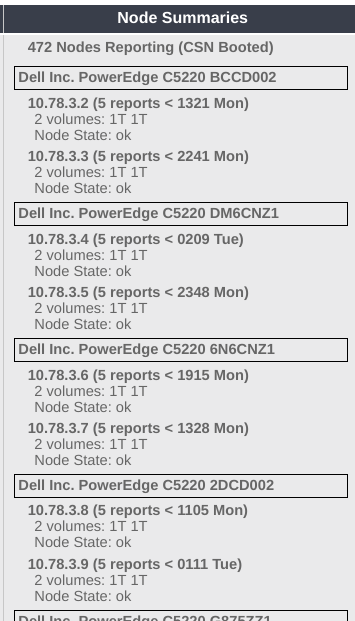
Here you’ll see a listing of all the nodes reporting over the past 2 weeks. In this example, the first node (remember that a “node” is the individual Swarm process - there could be multiple sharing the same physical chassis) is at 10.78.3.2, has sent in 5 reports, the most recent of which arrived at 1321 on Monday (US Central time). It has two 1TB drives, and it’s node state is “ok”.
Load, HP Cycle, etc. Graphs
The next panel contains graphical representations for some of the data already discussed as text.
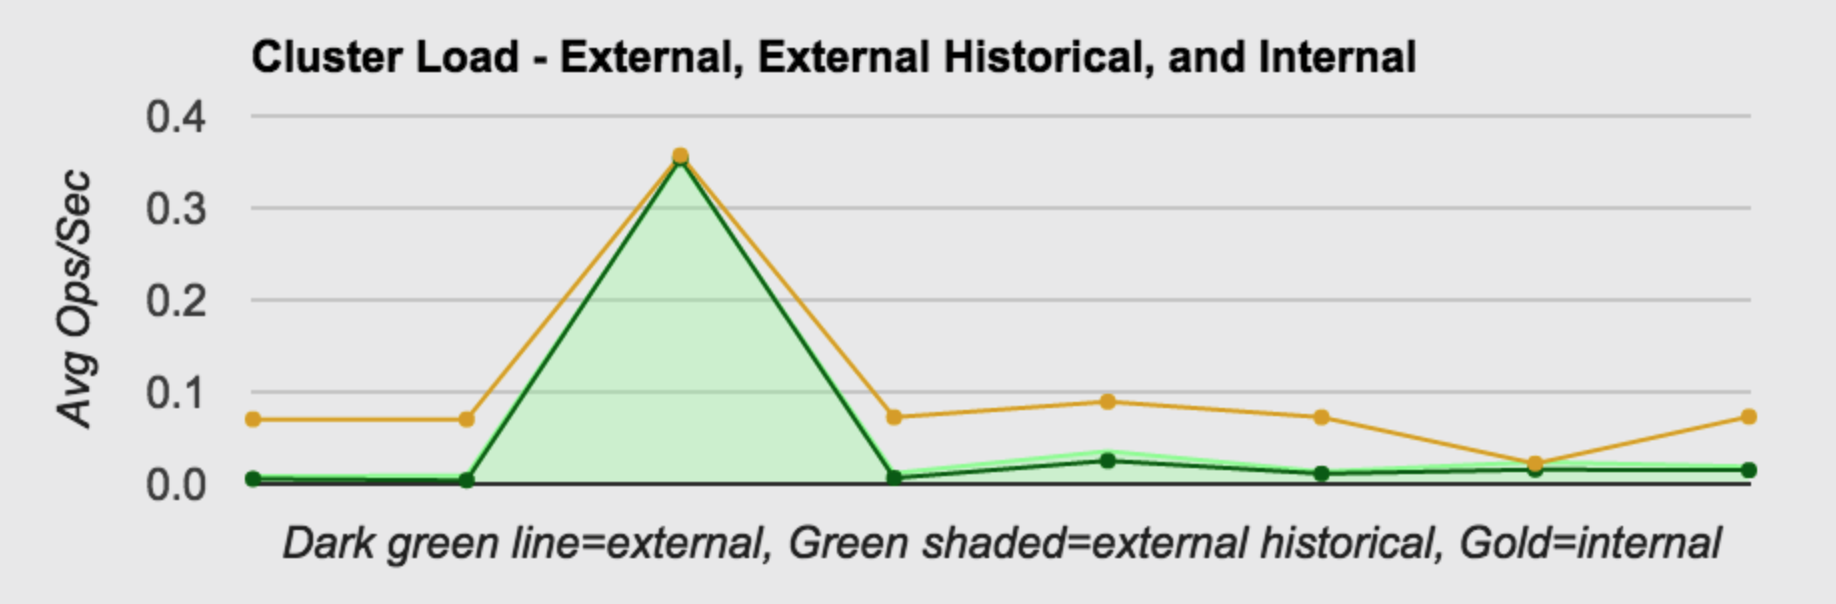
Cluster Load
This graph shows cluster load trend in terms of operations per second over the past 24 hours. Remember that nodes don’t all report at the same time, so the time period for each node might be a bit different, but it should at least represent a trend. The dark green line is the load resulting from SCSP (external) operations. The light green shaded area represents the history since cluster boot. The golden line represents the load resulting from internal operations, primarily the result of the work of the health processor.
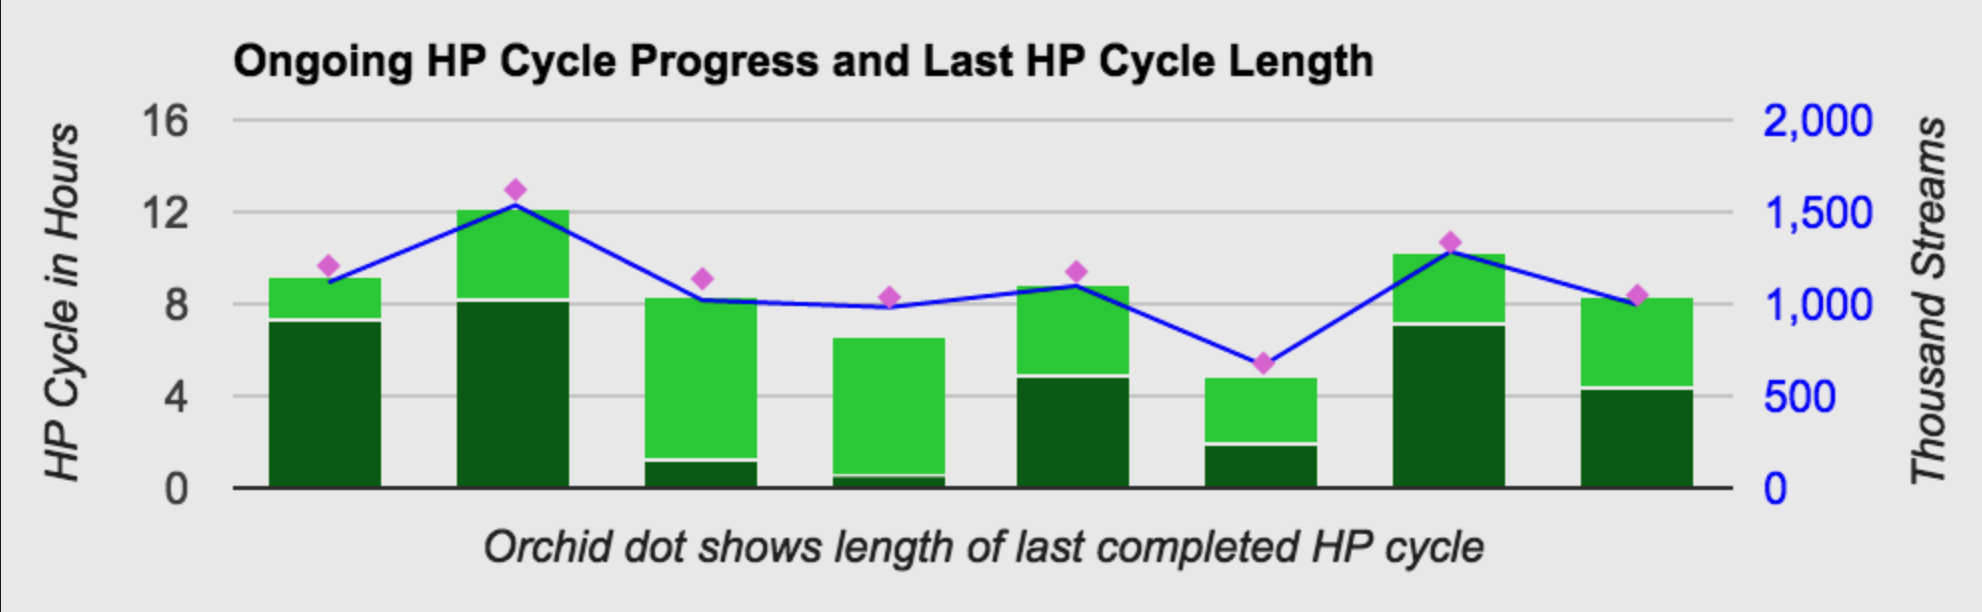
HP Cycle Progress
This graph describes the progress of the health processor on each node in the cluster. The orchid dot is the time required for the last completed health processor cycle. The green bar represents the ongoing health processor cycle. The dark green part represents the completed portion, and the light green is a projection of how long the remainder of the cycle will take. The blue line is the number of objects (in thousands) on that node - this is relevant since HP cycle length is generally proportional to number of objects on that node.
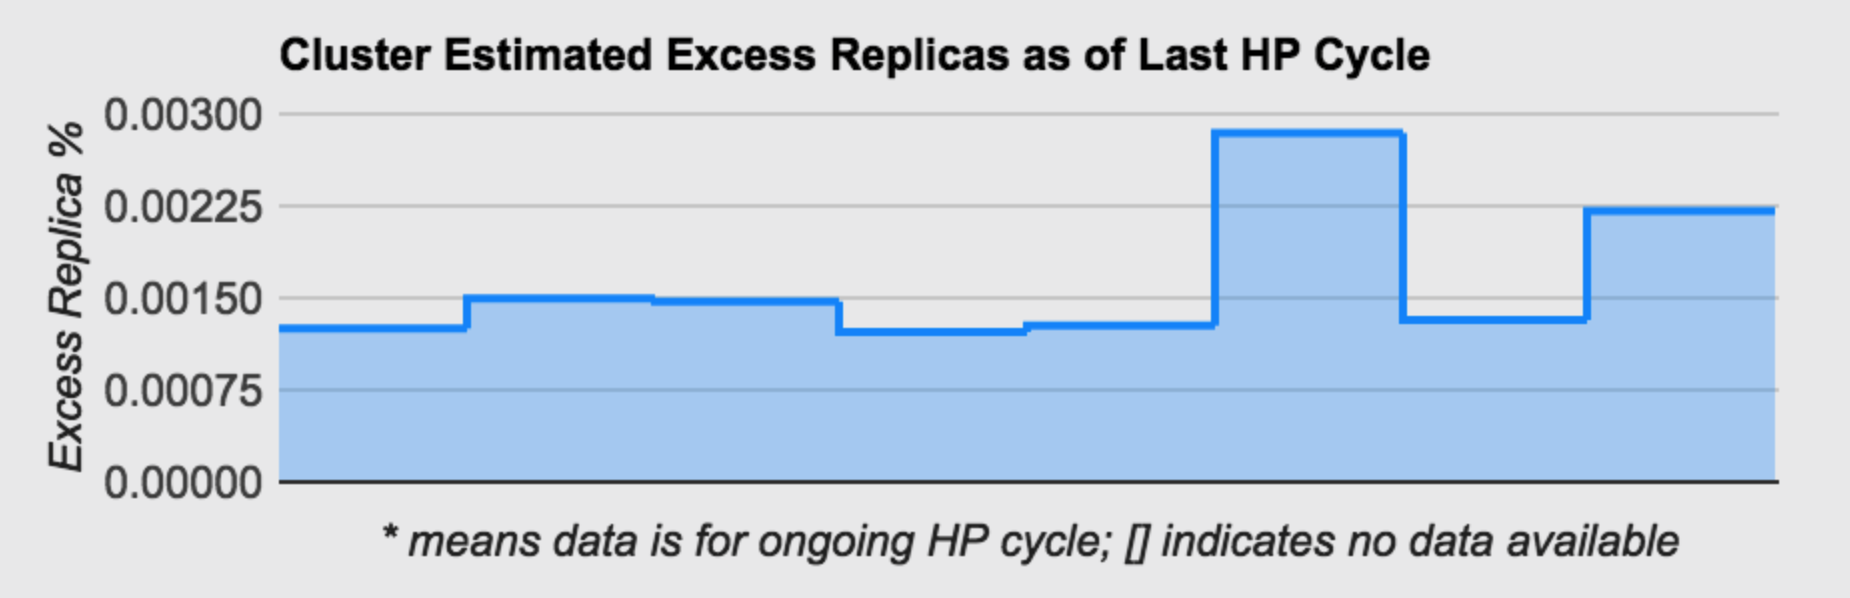
Excess Replicas
This graph shows an estimate of over replication in the cluster. A certain degree of over replication is normal - as the health processor moves objects around to optimize cluster balance and performance, it will conservatively not delete the previous replica until it has validated replication, so there is a window of time where an excess replica is both normal and desirable. However, high numbers here (more than 5% or so) are likely to be the result of a temporary hardware or network failure which caused Swarm to increase replication to protect data. That isn’t normally a problem, but it may take several health processor cycles to completely clean up the resulting over replication. The cleanup process will proceed much faster in clusters large enough to enable the overlay index.
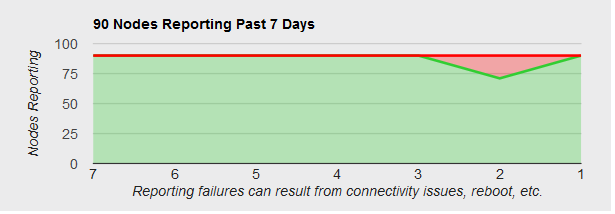
Nodes Reporting
This graph simply reports the number of nodes sending health reports over the past 7 days. In this example a chassis was rebooted 2 days ago so on that day only 71 nodes reported in. The scale in the bottom is the number of days ago.
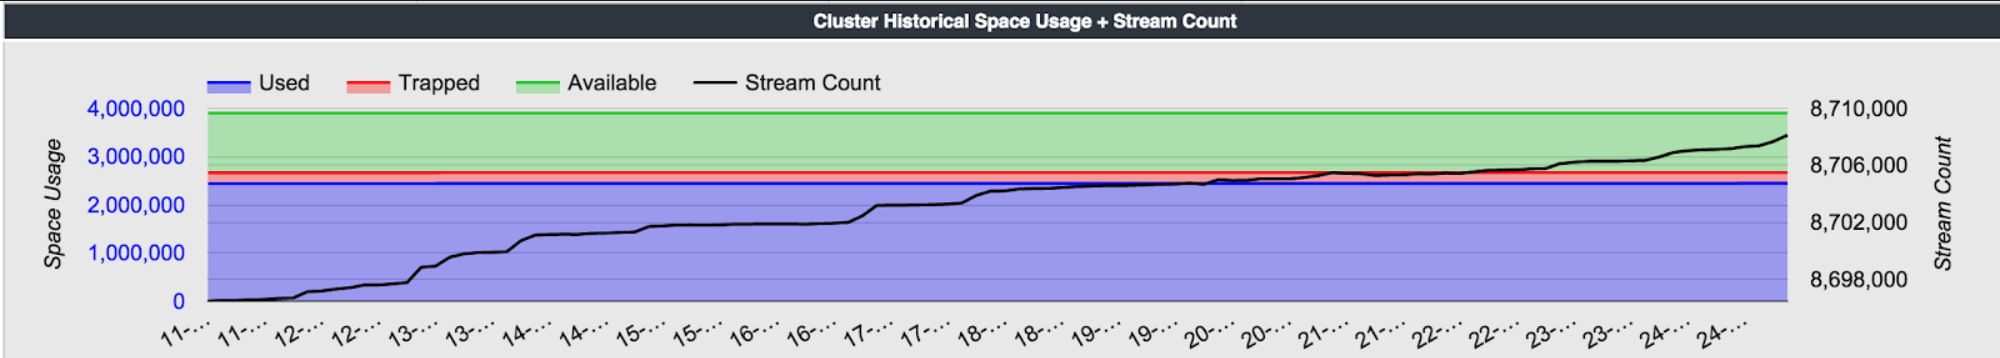
Cluster Historical Space Usage
This chart shows space usage in the cluster over the past 14 days. Blue is used space, green is available space, and red is “trapped” space, that is, space which is no longer in use, but which has not yet been defragged and reclaimed. The black line is the number of streams (objects) stored. Note that the scale on the left is for space, and the one on the right for streams.
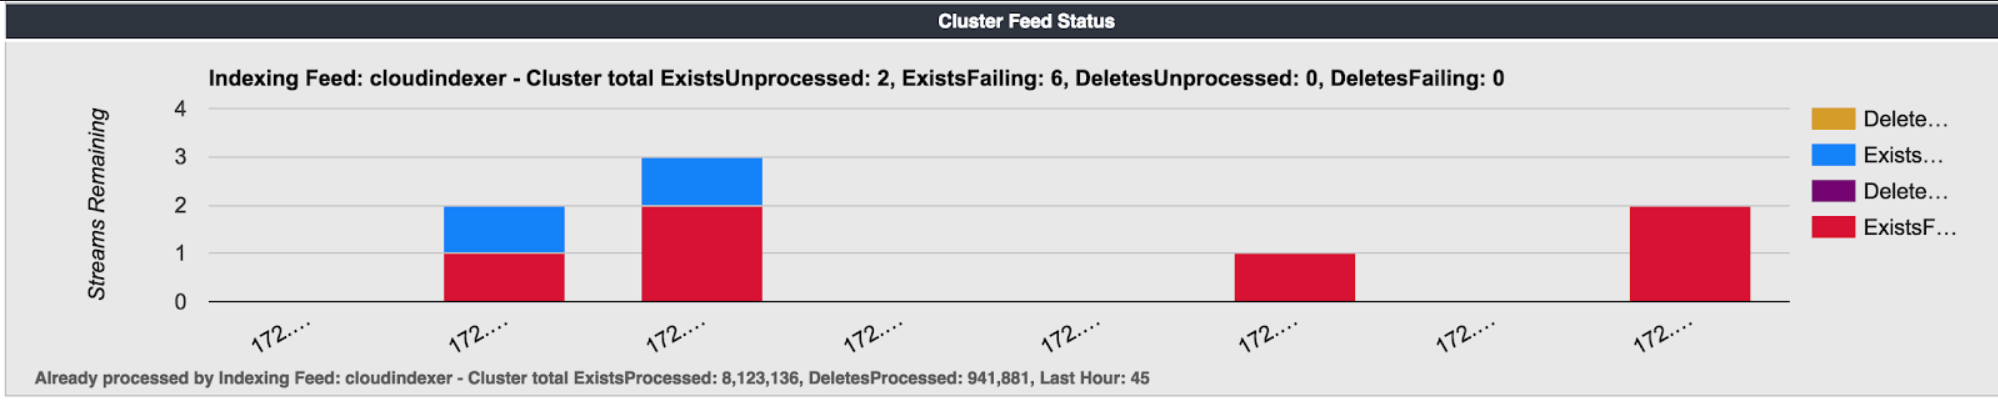
Feeds Progress
If your cluster has any feeds (search or replication) defined, you’ll see a graph below the historical space usage indicating the status. Note that for each object, Swarm notifies the feed that the object exists (was created or touched) or was deleted. There are four possible values that can appear for each node, representing whether that notification failed or succeeded.
© DataCore Software Corporation. · https://www.datacore.com · All rights reserved.