...
Metering is not enabled.
Metering is enabled but without connection (which may be temporary).
Metering data has is not yet been collected.
Storage Reports
The Storage reports show the amount of capacity. They are inclusive of all versions, replicas and erasure-coded segments that are stored at each level.
 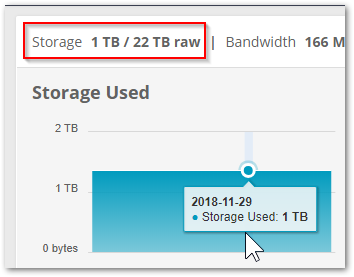 |  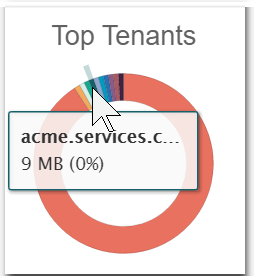 |
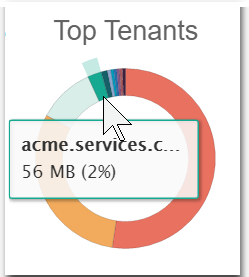
Graph - A historical storage capacity report where the average of all storage data points on a given day is plotted over a rolling 30 day window. Used - The total amount of storage capacity in use for the given level. Root level only. The amount of storage capacity still available for use in the cluster. | Graph - The top 10 highest consumers of storage capacity in the given level at the time the chart was displayed. Percentage - The relative size of the displayed segment represents the percentage of the total for which a given consumer accounts. If one tenant uses half of the capacity in the cluster, that tenant is represented on the root level Top Tenants report as half of the circle. |
...
The Bandwidth reports show the amount of activity. They are inclusive of all bandwidth (both bytes in and bytes out) used at each level.
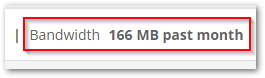 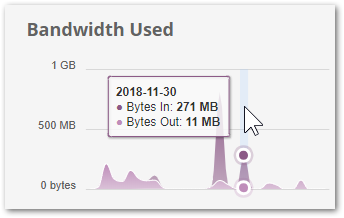 |   |
Graph - A historical bandwidth report where the sum of all bandwidth data points on a given day is plotted over a rolling 30 day window. Bytes in and bytes out are represented by two different stacked colors in the chart. Used - The total amount of bandwidth used for the given level in the last 30 days. | Graph - The top 10 highest consumers of bandwidth in the given level over a rolling 30 day window. If there are more than 10 data points for a level, the 11th and all other data points are grouped into an Other segment. Percentage - The relative size of the displayed segment represents the percentage of the total for which a given consumer accounts. If one tenant uses half of the bandwidth total for the tenant over a 30 day period, that tenant is represented on the root level Top Tenants report as half of the circle. |
...